Climate Science & Modeling

  • Phys.org - News and Articles on Science and Technology

    Article

    Tokyo's hidden methane: Survey pinpoints nearly 100 hot spots

    Carbon dioxide (CO₂) has been the poster child of climate change, but another culprit could be flying just under the radar. Methane is a potent greenhouse gas with a global warming potential approximately ...

    · 4 min read

  • Phys.org - News and Articles on Science and Technology

    Article

    Climate communication that resonates must be based on empathy

    Climate change is a global reality, but people often encounter it through different local realities. For some, it enters everyday life through social media feeds, news reports, scientific findings and ...

    · 6 min read

  • CliMA - Climate Modeling Alliance

    Article

    Coda: what it took to build a new Earth system model

    By Tapio Schneider and Raffaele Ferrari A coda to our tour of the CliMA software stack. The series began with why we built a new Earth system model; last week we covered how it all came together.

    · 5 min read

  • CliMA - Climate Modeling Alliance

    Article

    Putting it all together: ClimaCoupler.jl

    By Henry Peterson, Akshay Sridhar, Tapio Schneider, and Raffaele Ferrari Part 13 of our tour of the CliMA software stack. The series began with why we built a new Earth system model; last week went from Hadley cells to atmospheric rivers.

    · 11 min read

  • Rewilding Britain: Think Big. Act Wild.

    Article

    The Wild View: Calming the flood-drought climate whiplash

    We cannot concrete our way out of climate extremes; turning our countryside back into a natural sponge is the key to escaping the flood-drought whiplash.

    · 13 min read

  • CliMA - Climate Modeling Alliance

    Article

    Why driving fast does not clean your car: SurfaceFluxes.jl

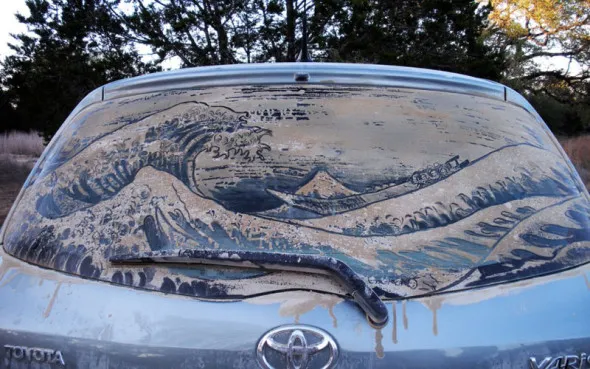
    Part 10 of our tour of the CliMA software stack. The series began with why we built a new Earth system model; last week covered a land model that learns from data. No matter how fast you drive, the fine dust on your car will stay put.

    · 10 min read

  • Benny Istanto - Exploring Climate with GIS, and Data Science

    Article

    Twenty-six hours to three: a global drought index at four kilometres

    Seventy-six years of monthly water balance for every land pixel on Earth at four kilometre resolution used to take twenty-six hours to compute. It now takes under three.

    · 12 min read

  • CliMA - Climate Modeling Alliance

    Article

    Putting a planet on a grid: ClimaCore.jl and ClimaTimeSteppers.jl

    Part 8 of our tour of the CliMA software stack. The series began with why we built a new Earth system model; last week covered how we learn a climate model’s parameters from data.

    · 11 min read

  • Benny Istanto - Exploring Climate with GIS, and Data Science

    Article

    Into early 2027, and how little forty-four events support

    The closing post. What the horizon looks like once the warming trend is taken out, how little independent information nine hundred months contains, and the three things this project got wrong and had to fix.

    · 9 min read

  • Benny Istanto - Exploring Climate with GIS, and Data Science

    Article

    Where El Niño drought risk is real, and where it is not

    Evaluating the fitted relationship at a forecast beyond anything used to fit it. The chance of a record season runs four to five times higher than chance, about half of that is the warming trend, most of the world has no business being asked, and

    · 10 min read

  • Benny Istanto - Exploring Climate with GIS, and Data Science

    Article

    What the five closest El Niños did to the land

    The strongest matching seasons on record, composited. Rainfall at 61 per cent of normal across the Maritime Continent, five analogues out of five agreeing, and a correction that has to be applied before any of it can be read.

    · 9 min read

  • CliMA - Climate Modeling Alliance

    Article

    From tuning by hand to learning from ClimaParams.jl and ClimaCalibrate.jl

    By Nat Efrat-Henrici and Tapio Schneider. Part 7 of our tour of the CliMA software stack. The series began with why we built a new Earth system model; last week covered how to calibrate a model of a chaotic system.

    · 8 min read

  • Benny Istanto - Exploring Climate with GIS, and Data Science

    Article

    Where the world is dry right now, in rainfall and in thirst

    Not a forecast and not a composite: the observed state of both halves of the water balance through August 2026. The Sahel is at SPI-3 of -2.39, half the Maritime Continent is already in a dry spell, and a quarter of the world’s land is dry on one

    · 9 min read

  • Benny Istanto - Exploring Climate with GIS, and Data Science

    Article

    Ten minutes over the Sunda Strait

    Anak Krakatau erupted at midnight and the ground observers could not see the ash column. A satellite photographs the whole hemisphere every ten minutes, in sixteen colours. Here is what each of them shows.

    · 15 min read

  • Benny Istanto - Exploring Climate with GIS, and Data Science

    Article

    Rain and thirst move together under El Niño, which is worse news

    The hypothesis this project was built to test was that El Nino makes some places wet and thirsty at once. On land where both responses are solid, that combination is 0.3 per cent. What is there instead is worse.

    · 8 min read

  • Benny Istanto - Exploring Climate with GIS, and Data Science

    Article

    El Niño starts dry spells, it does not make them longer

    Run theory on both halves of the water balance at four accumulation lengths. Globally El Niño changes almost nothing. Over the Maritime Continent it changes the share of months that come in below the dry mark by nineteen points, and it does it by

    · 11 min read

  • Benny Istanto - Exploring Climate with GIS, and Data Science

    Article

    Drought has two halves, and most maps measure one

    Drought is what arrives minus what leaves, and almost everything published measures only the first. This post builds the second, finds that a thirty-year baseline cannot express two of its own eleven categories, and then sets out what all of it is

    · 14 min read